Through the Eyes of a Hedge Fund Manager, Series #19
| 28 June 2024
Eriswell Market Insights
The Alpha Kaleidoscope
BY MARK PAGE, MANAGING PARTNER
+44 (0) 1932 240 121
info@eriswell.com


© 2026 Eriswell Capital Management LLP

Two reactions are triggered when stocks rally as much as they have. The first is regret; amongst
those who did not partake in the rally, those who missed out on segments like the “US Magnificent-
7”, and those who simply sold too soon. The second is a pervasive sense of scepticism which feeds a
deep-rooted feeling that a big correction must be overdue.
Put the two together and one ends up with what Eriswell calls ‘magic elastic band’ contrarianism. A
feeling that stocks must be overpriced simply because they have risen so much. As if a magic elastic
band has one of its ends anchored where the asset’s rally commenced, with the other end stretched
up to where the asset is trading today.
To believers in magic bands, stock prices are due a big correction as the elastic snaps them back into
line. To everyone else it looks like wishful thinking.
To put these beliefs on a firmer footing, investors require payment to take on the risks of
financing a company. From the company’s perspective this comes in the form of its ‘cost of capital’,
a type of interest rate it must pay its share and bondholders. The return on capital is the profit a
company generates.
The ‘cost of equity capital’ a company must pay its shareholders represents the company’s entire
profits after tax, interest, and other contractual payments, and may be more or less than the level
envisaged by the investor when they bought the stock.
This is basic stuff but as with many activities, get the basics wrong and you can expect a poor
outcome.
Valuing a company therefore boils down to projecting its expected future cashflows and then
risk adjusting them using a suitable discount rate (its cost of capital). To do this accurately
requires us to be firmly anchored in the objective reality pervading today with great care taken when
comparing its valuation today with how it has performed in the past. While historical comparisons
are commonplace, they’re only valid to the extent a company’s history, no matter how glorious,
remains a good representation of today.
This takes us to an area Eriswell finds itself continually at odds with mainstream forecasts.
We believe the objective reality today has been radically altered by the advent of zero-r* conditions.
And we have repeatedly argued that trouble will come in many sizes to those who fail to recognise
that, in zero-r* environments, fiscal stimuluses flow almost entirely into corporate profits and
onwards into the hands of the wealthy.
If true, a massive structural benefit to stocks and, so far, it certainly seems to be true.
And so, unsurprisingly, trouble has indeed come to those who failed to recognise that corporate
earnings would break free of their pre-2008 trends where profits were inextricably linked to wage
and nominal GDP growth (Fig 1).
Fig 1:
Okay, if we correct for large-scale zero-r* macro effects like the profit breakout we’re good to
go? Alas, no!
Zooming in we see that the benefits accrued by zero-r* dynamics have been far from symmetric.
Companies like the US ‘Magnificent 7’ with businesses protected by high moats and with products
facing marketplaces, fashions, and consumer behaviour boosted by zero-r* conditions have never
had it so good.
While other sectors including European banks and household discretionary retailers have endured
more difficult times. For example, zero-r* conditions drag on European net interest rate
margins—the lifeblood of retail banks—and many household discretionary retailers are reporting
close to their worst ever trading conditions.
Unsurprisingly both sectors have failed to return their cost of capital to shareholders.
This is presumably where stock analysts earn their money
Zooming in we see that the benefits accrued by zero-r* dynamics have been far from symmetric.
Companies like the US ‘Magnificent 7’ with businesses protected by high moats and with products
facing marketplaces, fashions, and consumer behaviour boosted by zero-r* conditions have never
had it so good.
You would think so, for using a combination of financial analytics and market understanding it falls
to stock analysts to separate the wheat from the chaff.
The process comes in two stages:
1. Macro picture
First, stock analysts must consider the macro environment including, for example, the shift away
from the traditional manufacturing base to a new technology-based economy. A shift which has
introduced many unforeseen changes including the anti-competition headaches regulators face
today and the winner-takes-all dynamic visible in many sectors.
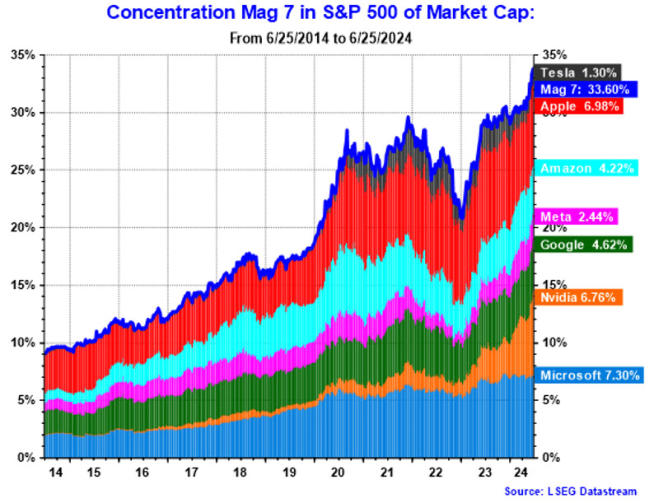
Which have powered the so-called ‘Magnificent 7’ into the stratosphere with these seven stocks
comprising almost 35% of the S&P500 index today (Fig 2).
Microsoft's dominance of application and business software has been the subject of anti-trust
actions for many years, but this did nothing to stop Amazon from beating a similar route to
dominance in the retail sector.
Meanwhile, the advertising industry was traditionally splintered with even the biggest media players
(TV and radio broadcasters, film, newspapers, advertising agents, etc.) commanding a modest share
of the overall market. Even the core advertising hubs were dispersed across many players including
the old Saatchi & Saatchi, Havas, Publicis, WPP, and Japan’s Dentsu. All changed when Alphabet and
Meta created dominant new platforms which today corner online advertising, powered by network
nodal benefits which see advertising flows increasingly sucked into the gravitational fields of the
largest and most frequented platforms.
Not to forget the sector’s new king, Nvidia, which is grabbing market share, revenues, and investors
imaginations as it forges a dominant new path into AI.
It falls to investors and analysts to figure out what the chip endgame might look like and while it is
true—as with advertising, retail, and application software before them—that microchips has never
been a winner-takes-all business, investors are starting to price in the possibility that Nvidia might
just dominate this market as the other tech giants dominate theirs. Fig 3 illustrates the explosive
rise of Nvidia since 2016.
Fig 2:
2. Intrinsic stock analysis: Problems, problems, problems
With the macro analysis completed, investors and stock analysts must marry these large-scale
factors into the specific circumstances of each company. This is where intrinsic stock analysis comes
in, where the stock analyst makes lots of assumptions and projections about sales growth, operating
margins, future profitability, the moats which protect a business, the future risk matrix, and
ultimately arrive at a target valuation. Subsequently translated into a target price and a Buy, Hold, or
Sell rating for the stock.
One can but marvel at the sheer quantity of information analysts crunch as part of each stock price
workup. Analyses which very much help investors to think about a business in the context of
whatever their core beliefs may be.
Nevertheless, intrinsic analysis remains exposed to the garbage-in/garbage-out (GIGO) principle:
screwup important assumptions and you will screwup your valuations.
Analysts at the big brokerage houses obligingly demonstrate the amazing diversity of such
screwups.
Analyst Forecasts: Chronic problems and a Massive opportunity
Zooming in we see that the benefits accrued by zero-r* dynamics have been far from symmetric.
Companies like the US ‘Magnificent 7’ with businesses protected by high moats and with products
facing marketplaces, fashions, and consumer behaviour boosted by zero-r* conditions have never
had it so good.
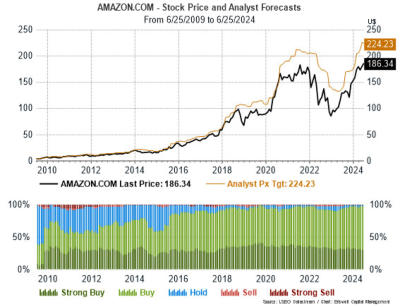
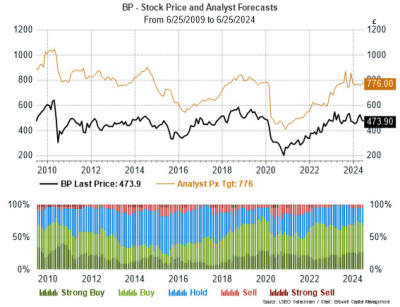
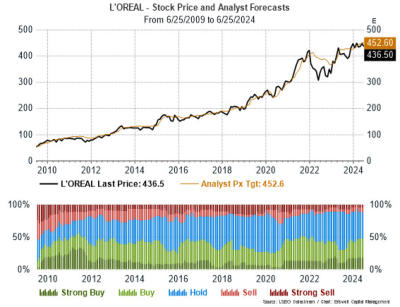
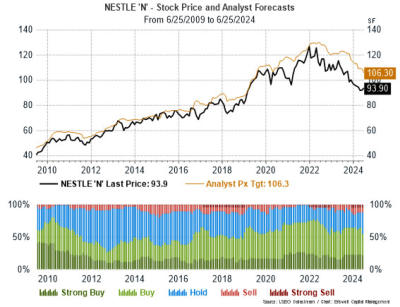
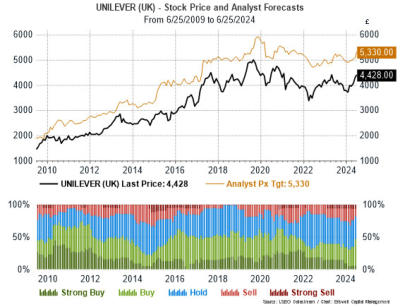
Figs below are drawn from a random sample of stocks: the black line in the upper pane represents
the traded stock price, the brown line the consensus analyst stock price forecast. The lower panes
depict the proportion of analyst Buy and Sell ratings at any point in time.
It’s a theme we’ve followed since 2009: sell-side analysts possess no predictive power whatsoever
as countless academic studies attest. Analysts seem to end up setting their stock price targets
around 10% above wherever the stock price happens to be trading. Sure, these are typically 12-
month price targets in which time the company will supposedly have paid investors their cost of
capital. If only life were so simple.
Perhaps there’s another reason why analysts possess so little predictive power: all investors get
access to the same information at the same time.
A priori we would expect the market to swiftly assimilate information it is familiar with, leaving the
trickier problems aside until later. As we all do when faced with a difficult exam; first answer the
questions we’re familiar with, returning to the more difficult problems later. It is here investors are
most likely to be led astray by what others are thinking.
We’re now at the inner core of Eriswell’s belief system: Analysing ‘uncertain’ and
‘unprecedented’ information. Investors and analysts are generally comfortable dealing with run-
of-the-mill new information while ‘unprecedented’ and ‘uncertain’ information is more difficult.
It’s worth exploring this notion a little further:
The large brokerage houses routinely process vast pools of information, which renders their dismal
failure to accurately forecast asset prices something of a conundrum. By synchronously turning the
handles of standard valuation models there can be no doubt that the sell-side helps markets digest
prodigious quantities of new information.
Over time, however, the rigidity and homogeneity inherent to these conventional techniques
encourages analysts to develop systematic blind spots. Blind spots where the poorly understood,
unprecedented, and uncertain factors can quietly develop out of sight.
Eriswell calls them ‘stealth factors’.
At this point forecasting failure becomes all but inevitable as the market struggles to discount these
stealth factors into stock and bond prices via the normal price discovery process. Destined to lie
dormant for a while, before popping up somewhere to surprise investors and trigger an earnings or
other surprise.
An asymmetric asset price return profile inevitably follows, bouncing stock analysts into the
backseat where they are left to devise authoritative explanations about things they had never
spotted in the first place. Switch on CNBC or Bloomberg Markets for real life examples!
It’s a funny old game where uncertain, unprecedented, and poorly understood factors become the
final arbiters of asset prices.
But remember, for investors ahead of the game, these ‘unexpected’ price nonlinearities represent
deep pools of opportunity; alpha, in other words the stuff we’re all after.
Now think about it
It’s hard to imagine a less-precedented and more uncertain backdrop than today’s zero-r*
conditions.
There have been so many analyst, institutional, and central bank mistakes over the past few years
that many ‘experts’ are resorting to complex arguments to hide rather than developing simpler
arguments to explain:
“There are horrible people who, instead of solving a problem, tangle it up and make it harder to solve for
anyone who wants to deal with it. Whoever does not know how to hit the nail on the head should be asked
not to hit it at all.” Friedrich Nietzsche
Forecasting the future or tracking the past? You decide
Let’s start with Nvidia (Fig 36), can you see the way stock analysts deftly spotted the impending
explosion in its stock price? No, neither can we! Turning to Amazon and Microsoft (Figs 3 & 23), can
you see how analysts did very much better? Neither can we!
UK Furniture retailer DFS is a simpler, more modest affair than the tech goliaths; surely analysts did
a better job there? Alas not; they remained hopelessly bullish in H2 2021 with consensus forecasts
about 3x the level DFS trades today (Fig 37). Unaware that DFS’s customer base is very much drawn
from the zero-r*’s ‘have nots’, analysts, alarmed by the downward spiralling stock price, were forced
to repeatedly cut their target prices.
This collective loss of nerve expresses itself in a phenomenon Eriswell terms ‘price hugging’,
whereby in times of stress, analysts seek the safety of the herd by continually tweaking their
valuation models to keep forecasts in line with traded stock prices. Consequently, it is no longer
analysts who drive stock prices, rather traded stock prices which drive the analysts’ price targets.
The cart has somehow ended up before the horse.
Now you may say, so what, analysts make honest guesses and sometimes get it wrong... we
all do sometimes. We agree and many analysts do too; the trouble is, most find themselves softly
pressurised by their employers to get their forecasts back into line with traded prices. Such soft
pressure remains common practice even though explicit pressure is forbidden.
In effect, analysts find it hard to openly express their opinions which in turn opens the murky waters
of face-to-face meetings with favoured clients where private feelings can be more freely expressed.
Whether this is of any value is another question.
This practice ends up leaving investors in something of an information vacuum in which they receive
retrospective explanations about the past as opposed to unbiased guidance about where stock
prices might be headed.
Which is the whole point of the exercise.
Conclusion
It would be unfair to write off the stock analyst community, they’re doing their best in an uncertain
world. Where both earnings outcomes and the valuations investors are prepared to assign to them
are in a state of flux. A world in which even the best of us makes mistakes.
Every era brings its own complications, but zero-r* idiosyncrasies can magnify these into a
tsunami where positive and negative factors alike can gain the power to wash away those
who didn’t see it coming.
As for fundamental stock analysis, is a waste of time? Not at all, in fact Eriswell believes it to be the
only coherent tool to value a stock in terms of what we see in the company’s future whether that be
awesome or terrible. Notwithstanding which, to accurately value a company’s stock in today’s zero-
r* world we must adapt these techniques to capture how companies may fare in these largely
unprecedented circumstances.
Afterall, investing is always about the future. A businesses’ history, no matter how illustrious,
only has relevance to whether it represents a good investment to the extent this history remains
applicable today.
Part 2 of this note will examine how exactly we adapt intrinsic valuation metrics to today’s zero-r*
world.
Kind regards,
Mark Page