Things could get complicated for U.S. and European equities. Why?
We can’t reliably predict where something is headed unless we know roughly where it comes from,
how it works, and where it’s headed. In which light, valuing stocks may be decomposed into two
principal steps: (i) projecting expected future earnings and (ii), risk adjusting them using what is
known as the stock discount rate.
Projecting future earnings is conceptually straightforward, if tricky in practice, whereas risk-
adjusting them is a somewhat murkier process.
Yet, it held the key to an intriguing anti-consensus forecast Eriswell made back in May 2016 that
stock prices would surge:
“The same models which predicted that bond yields would fall to zero now predict that stock
discount rates should fall to 6% and possibly lower. A swing back to the Greenspan years helps bind
this prediction in with current Fed action.
“Perhaps we are witnessing the next counterintuitive, but nevertheless logical facet of liquidity trapped
markets, a falling discount rate…….”
Which is exactly what happened. The U.S. ‘stock discount rate’ fell from 8% to below 6% and U.S.
stock prices more than doubled between 2016 and 2020 (Chart 1).
So, what was the role of stock discount rates in this move, and what is the longer-term outlook for
stocks?
i.
Most important long-term drivers of stock prices are dividends and earnings
We use the S&P 500 index for illustration purposes, but the arguments equally apply to European
stocks.
The first step is to disaggregate dividends from stock prices. For the purpose of simplicity, one can
think of dividends as the cash a business can pay out while retaining sufficient money to fund its
journey into the future.
US dividends have averaged about 2% per annum over the longer term, and it’s reasonable to
assume that this will continue.
Turning to the underlying stock prices, we might expect their value to rise and fall in synch with
their expected future earnings streams. Which we would in turn expect to remain roughly hooked
to what economists call nominal GDP growth; that is the total monetary value of all the
transactions comprising the economy. Nominal GDP growth has two components, real-GDP growth
and inflation, and in the U.S., both have averaged about 3.2% since 1947. This equates to trend
U.S. nominal GDP growth of 6.4%.
Adding this 6.4% nominal GDP growth to the 2% dividend yield gives us 8.4% per annum. Toss into
the equation effects such as a secular increase in the share of GDP earned by capital and the
expected total annual return for U.S. stocks rises to about 9% per annum.
And that’s basically it.
In terms of achieved returns: Warren Buffet’s Berkshire Hathaway tells us that the S&P 500
delivered an average total return (dividends + stock price increases) of 10.2% between 1965 and
2020.
That’s a touch higher than our expected 9% annual total return, but basically in line.
More recently – since the 2008/09 Global Financial Crisis (GFC) – S&P 500 returns have averaged
14.5% per annum. This rate of increase accelerated to 15.8% in early 2016 (Chart 1).
Is this just an extended period of post-GFC catch-up, or is something else going on?
Let’s investigate….
Chart 1: S&P 500 returns 2010-2020
ii.
Enter the stock market discount rate
With some idea about the long-term trajectory of dividends and corporate earnings, we have just
calculated by roughly how much we expect stock prices to rise in the future.
But from what starting point? What would we pay to own a stock or index today?
To answer this question, we use a process known as ‘present valuing’ to figure out what we would
pay for the expected future earnings and cashflows of a company or index today. This is derived
using a ‘stock discount rate’, which represents the rate of return required by shareholders to hold a
stock (blue line, Chart 2).
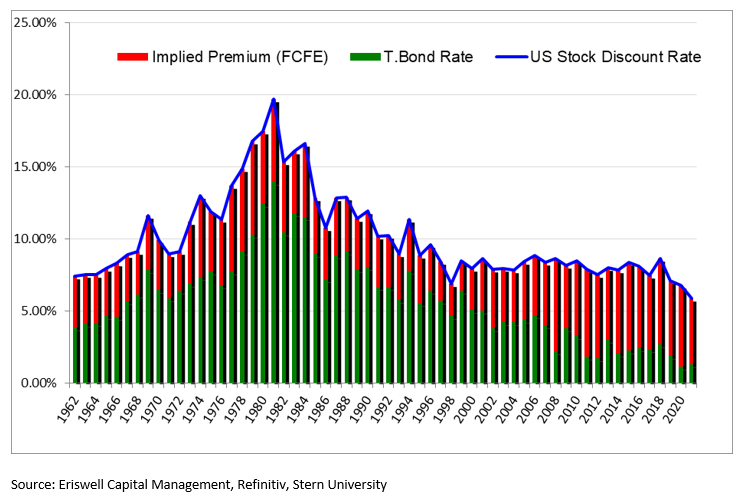
The stock discount rate can in turn be decomposed into two components: (a) the ‘risk-free rate’
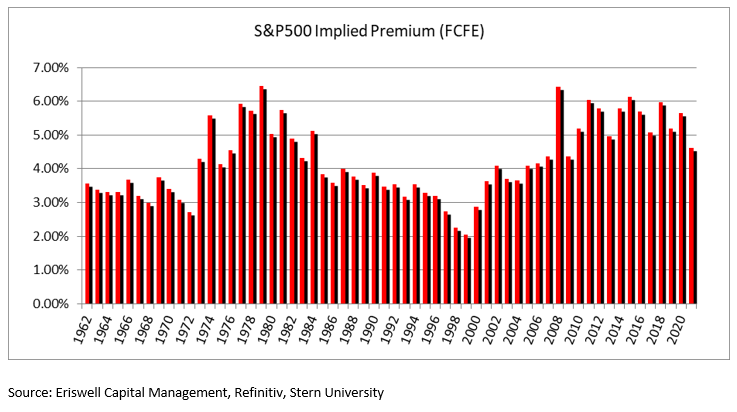
(typically US Treasury bonds, green bars, Chart 2), and (b) the ‘equity risk premium’ (red bars). The
equity risk premium is the excess annual return an investor requires to hold a stock as opposed to
a safe government bond.
If the stock discount rate falls – either because government bond yields fall, or because
shareholders are happy to accept a smaller equity risk premium – then stock prices will naturally
rise and vice versa.
Normally market professionals largely forget about movements in the stock discount rate. This is
because, since powering a massive post-1982 stock price rally, the U.S. stock discount rate flatlined
around 8% for the two decades between 1996 and 2016.
Then in 2016 Eriswell’s and some other new models – specifically designed for zero interest
rate conditions – unexpectedly forecast that the U.S. stock discount rates would fall from 8%
to 6% thereby catalysing a 60%+ jump in U.S. and European stock prices.
As it turned out, the S&P 500 went on to double in value between 2016 and 2020, a move which
blindsided the vast majority of mainstream strategists and fund managers.
Conclusion: Stocks were never a forever trade ….BUT
With current high valuations, care should be exercised when listening to those rocking up late to
the equity party, just as the band is packing up to go home.
Stock discount rates cannot fall forever as investors won’t accept endlessly lower excess returns to
own a stock. We therefore expect stock discount rates to settle around their new lower levels.
But, and it’s a BIG BUT: a falling stock market discount rate holds the key to a stock market bubble,
a risk all investors should remain alert to in today’s frothy markets.
Finally: none of this is an argument against stock prices rising in line with longer-term nominal-GDP
growth, whatever that turns out to be. Rather that stock prices are in danger of running somewhat
ahead of themselves today.
Chart 2: S&P500 Index discount rate decomposed into equity risk premium and risk-free rate
January 1961 - September 2021
Chart 2: S&P 500 Equity Risk Premium, January 1961 - September 2021


Economies and Capital Markets Series #7
| 23 September 2021

Eriswell Market Insights

Stocks were Never a Forever Trade
BY MARK PAGE, MANAGING PARTNER
+44 (0) 1932 240 121
info@eriswell.com


© 2026 Eriswell Capital Management LLP


