Staying curious opens our minds to new possibilities of what might be. But it can also be a
vacuum that sucks us in.
To balance the two outcomes, we must first focus on what we feel certain about and then use
this as a basis for making educated inferences about what should be.
While always considering how ‘what we don’t know’ may affect the things we feel certain about.
The American physicist John Wheeler compared the interdependent motion between a distant
star and a nearby black hole to a dimly lit ballroom where women in white dresses are dancing
with men in black tuxedos. You can only see the women but can infer the existence of their
invisible male partners from the women’s spinning and whirling motion.
Then, if your theory works out, great. And if it doesn’t, you must consider why this might be.
There’s no point in saying, “but that shouldn’t be, I’d never have made the world that way”.
Unless you’re God that is!
Then keep going round and round until you figure out what’s going on.
Image: Eriswell Capital Management
Back to investing
Over the past year, bonds have suffered the worst real returns – returns adjusted for inflation –
since the early 1980s, when then Federal Reserve Chairman Paul Volcker was fighting a wage-
price spiral. Volcker ultimately prevailed, which heralded a 40-year fall in bond yields (bond
prices move in the opposite direction to yields).
Now, we know – or at least we think we know – that government bond yields are one of the
most important axes around which almost all asset prices revolve: stocks, corporate debt, gold,
real estate, fine art, etc. And over the past 40-years, falling bond yields have been one of the
principal juices for both economic growth and rising asset prices.
In July 2020, this juice finally ran out as 10Yr US Treasury yields hit a low of around 0.5%. They
had nowhere else to fall. Worse, like the women in white dresses, falling yields reflected other
darker forces within our economies. Forces which are hard to measure and even harder to
understand.
Consequently, to try and plug the gap as yields started to rise, governments were forced to
start spending like Billy-O.
And with that, the rules of the game radically changed.
Isn’t it at least worth considering what this means for asset prices in the longer term?
For your savings? For your, pension? For your life?
Now, you might ask if there is any precedent for what has changed in Western
economies. It’s by no means perfect but, yes, there is. Or at least something that has the same
common denominator.
Enter stage, another 40-year period, this time in Japan. In January 1950, Japan’s Nikkei 225
index traded at 92. Over the next 40-years it bounced around, but those following “buy and
hold” strategies were handsomely rewarded. By the end of December 1989, the Nikkei 225
traded at 38,916.
Then ‘something’ dark but subtle changed in Japan.
By the end of March 2003, the Nikkei 225 had fallen to just 7,972, meaning investors in
Japanese stocks had lost over 80% of their money! Almost 10-years later, in July 2012 the Nikkei
225 remained stuck at 8,696. Today, it is trading around 28,000, less than half its value in 1989.
Now there’s some maths we need to do here to make precise measurements, but you get the
idea.
Unsurprisingly, Eriswell spent long nights searching for what exactly went wrong in late-1980s
Japan?
What if I told you the same dark things are going wrong in Europe and the US today?
What if I told you the Federal Reserve is deeply concerned? Or that top hedge funds have been
closely monitoring these developments for years? True, Western stock markets are nowhere
near as overvalued as Japanese stocks were back then, but similarities nevertheless remain.
And don’t forget that bubbles are much easier to identify in the rear-view mirror.
We’ll summarise the details of what is going wrong in a forthcoming series. So, let’s get back to
investing.
A Radically New Retail Portfolio
In August 2021, we were investigating the possibility that a “lower-risk” portfolio might
be able to protect against the inflation storm we forecast at the time. And then, hopefully
continue to outperform in the low inflation bust we forecast next.
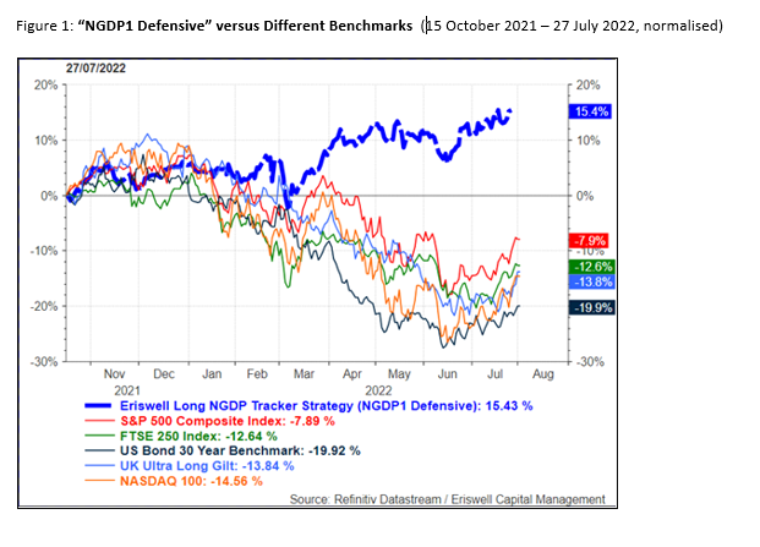
By following the flow, in October 2021 a radically new portfolio was born (Figure 1).
We called this Eriswell’s “NGDP1 Defensive”, depicted in blue below.
Far from what conventional finance expected, “the NGDP1 Defensive” portfolio was
chock full of stocks. Albeit stocks with some very special characteristics. In fact, this portfolio
contained no bonds at all, and curiously – given Eriswell’s inflation forecast – no index linked
bonds. Which turned out to be a good thing as index-linked bonds have been hammered.
How has “NGDP1 Defensive” performed since its inception on 15 October 2021?
One might benchmark it against the standard retail 60:40 stock/bond portfolio. Or one might
benchmark it against one of the main stock market indices. It doesn’t really matter as all have
performed poorly (Figure 1).
Either way, “NGDP1 Defensive” has outperformed assorted conventional benchmarks by
around 23–30%. Even we were surprised!
To understand this strategy more fully, we need to understand more about this ‘something’ that
has gone wrong. As it did in late-1980s Japan.
Then, to make useful predictions, we need to understand where this ‘something’ came from,
how it works, the direction it’s travelling and, of course, what might eventually cause it to go
away.
It will then become apparent why tracking nominal-GDP (NGDP) is so important today.
Hence our strategy’s name.
The final step is to figure out which assets are likely to do that.
But that as they say is another story; it’s the subject of a new Eriswell series which I’ll link on
here:
www.eriswell.com
Through the Eyes of a Hedge Fund Manager, Series #12
| 3 August 2022
Eriswell Market Insights

How to Outperform when Uncertainty is High
BY MARK PAGE, MANAGING PARTNER

+44 (0) 1932 240 121
info@eriswell.com


© 2026 Eriswell Capital Management LLP


Infer
QUESTION
WHAT
SHOUlD BE
WHAT IS
Virtuous
Circle